

Air Pollution Across India
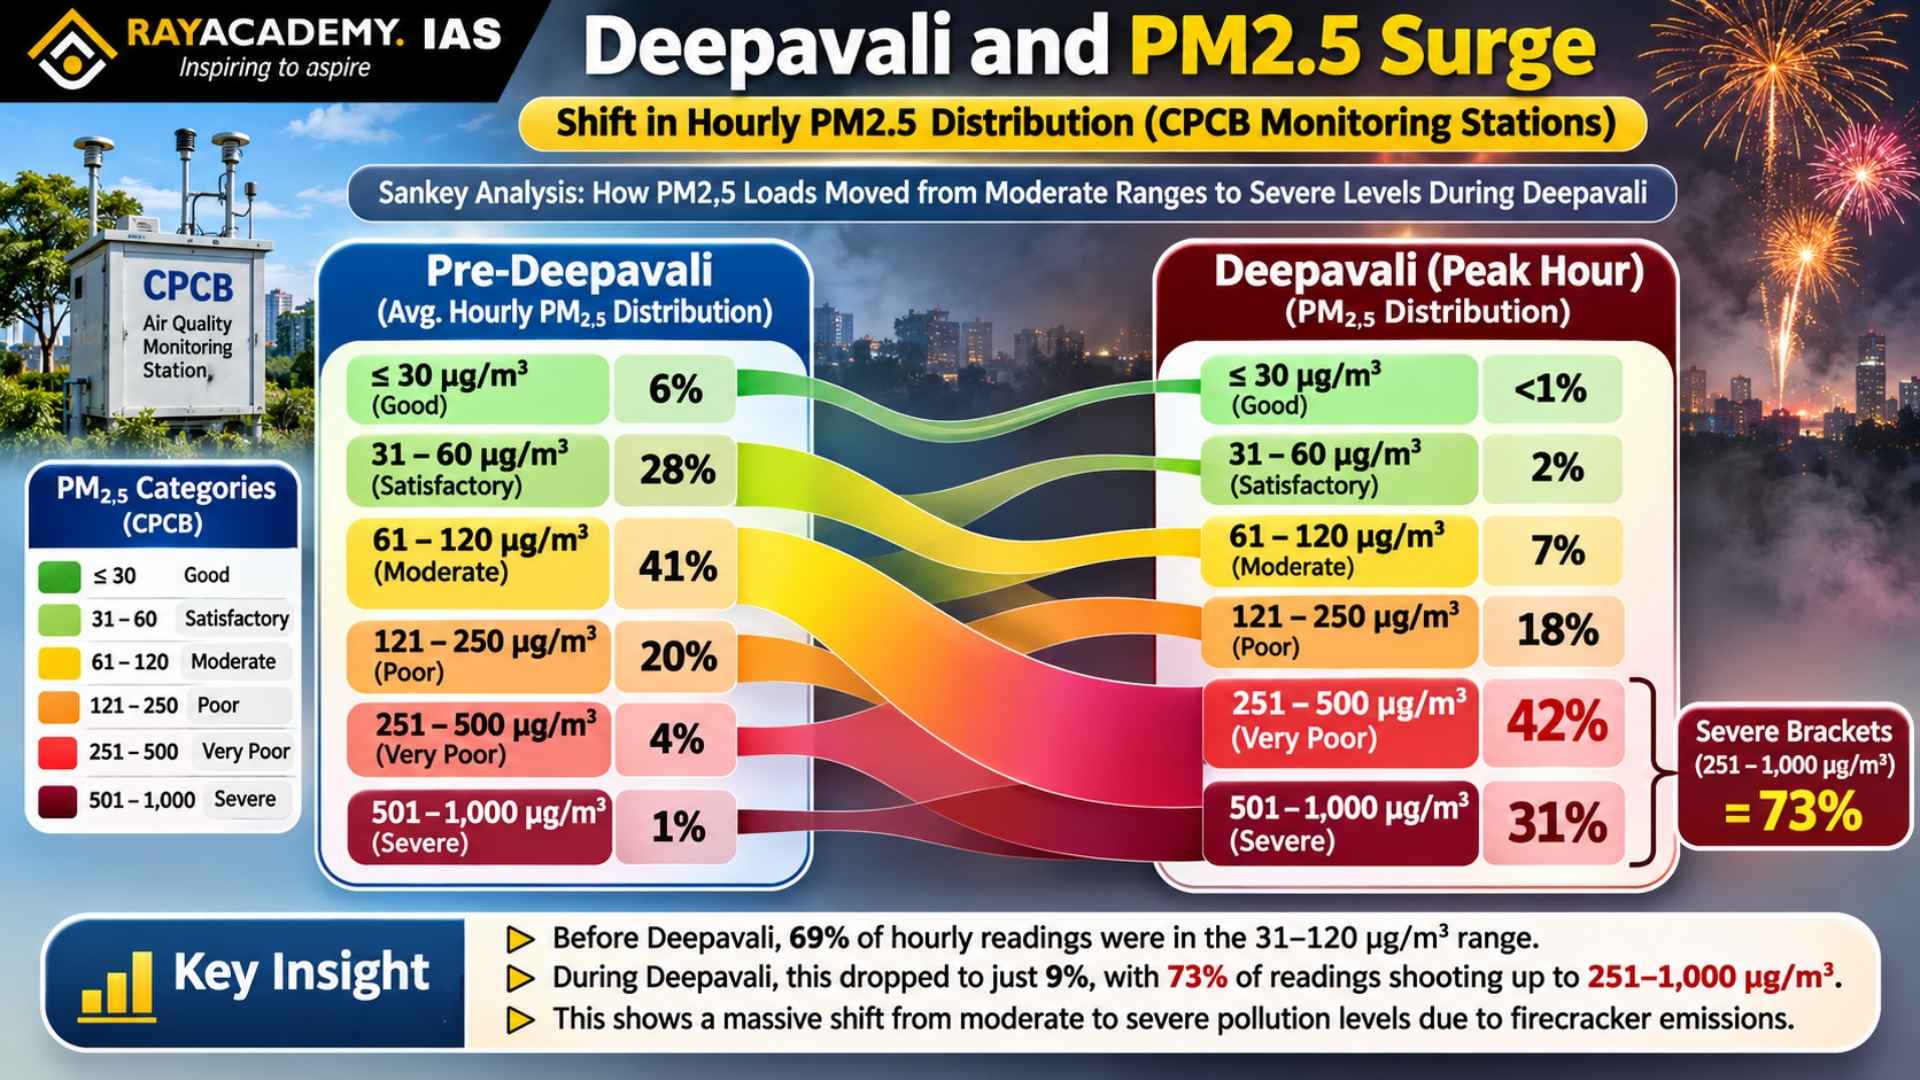
An empirical assessment of data from all 634 Continuous Ambient Air Quality Monitoring Stations (CAAQMS) operated by the Central Pollution Control Board (CPCB) revealed that nearly 70% of reporting stations across India recorded peak PM2.5 readings in the ‘severe’ category (250 micrograms per cubic metre or above) during the Deepavali festival window.
UPSC Syllabus Mapping:
General Studies Paper III (Environment & Conservation): Conservation, environmental pollution and degradation, environmental impact assessment; Air quality monitoring frameworks, statutory pollution control boards, and sustainable urban governance.
While national discourse routinely focuses on Delhi—where all 59 stations breached the severe threshold—at least seven other States (Maharashtra, Uttar Pradesh, Rajasthan, Haryana, Madhya Pradesh, Gujarat, and Andhra Pradesh) witnessed over two-thirds of their stations hitting severe PM2.5 levels. Simultaneously, the data exposed widespread monitoring blackouts: 202 of 571 live stations failed to report at least one hour of PM2.5 readings on Deepavali day, raising acute governance questions regarding sensor calibration limits and data transparency during extreme pollution episodes.
Static-Current Linkage: Air Quality Standards, CPCB Monitoring Architecture, and Legal Mandates
Evaluating India’s festive and seasonal air quality spikes requires linking environmental science with statutory regulatory frameworks and judicial directives.
National Ambient Air Quality Standards (NAAQS) and the Air Quality Index (AQI)
Under the Air (Prevention and Control of Pollution) Act, 1981, the CPCB notifies the National Ambient Air Quality Standards (NAAQS) covering 12 criteria pollutants: PM10, PM2.5, Nitrogen Dioxide (NO2), Sulphur Dioxide (SO2), Carbon Monoxide (CO), Ozone (O3), Ammonia (NH3), Lead (Pb), Benzene, Benzo(a)pyrene, Arsenic, and Nickel.
24-Hour Permissible Limit for PM2.5: 60 micrograms per cubic metre (Annual limit: 40 micrograms per cubic metre).
National Air Quality Index (NAQI): Launched in 2014 under the "One Number – One Colour – One Description" framework, NAQI tracks 8 pollutants (PM10, PM2.5, NO2, SO2, CO, O3, NH3, and Pb) across six categories: Good, Satisfactory, Moderately Polluted, Poor, Very Poor, and Severe (PM2.5 > 250 micrograms per cubic metre). Air Pollution Across India During Deepavali
Sensor Calibration Limits and Automated Data Validation
Continuous particulate analysers deployed in India’s CAAQMS network are typically calibrated for a maximum measurement range of 1,000 micrograms per cubic metre. During extreme emission surges—when ambient PM2.5 exceeds 1,000 micrograms per cubic metre—the CPCB’s automated data validation software flags readings outside the calibrated range as anomalies and discards them, resulting in "data gaps" precisely when pollution peaks. However, station-level logs from Deepavali 2026 show that the vast majority of stations going silent recorded their last reading at 500 micrograms per cubic metre or less—well within the 1,000 micrograms per cubic metre ceiling—pointing to power outages, telemetry failures, or maintenance lapses rather than range saturation alone.
Supreme Court Jurisprudence on Firecrackers and Green Crackers .Air Pollution Across India During Deepavali
In Arjun Gopal v. Union of India (2018), the Supreme Court balanced Article 21 (Right to Health and Clean Air) with Article 19(1)(g) and Article 25, banning conventional firecrackers containing toxic heavy metals (barium, lead, mercury, arsenic) and restricting bursting windows. The Council of Scientific and Industrial Research–National Environmental Engineering Research Institute (CSIR–NEERI) subsequently developed Green Crackers (SWAS, SAFAL, STAR) designed to reduce particulate matter and gaseous emissions (SO2 and NOx) by 30%–35%.
          ANATOMY OF INDIA'S FESTIVE AIR POLLUTION CRISIS
   ┌──────────────────────────────────────────────────────────────┐
   │ Pan-India Severe Surge: 375 of 551 active CAAQMS stations    │
   │ (~70%) breached 250 µg/m³ PM2.5 across 8+ States             │
   └──────────────────────────────┬───────────────────────────────┘
                                  ▼
   ┌──────────────────────────────────────────────────────────────┐
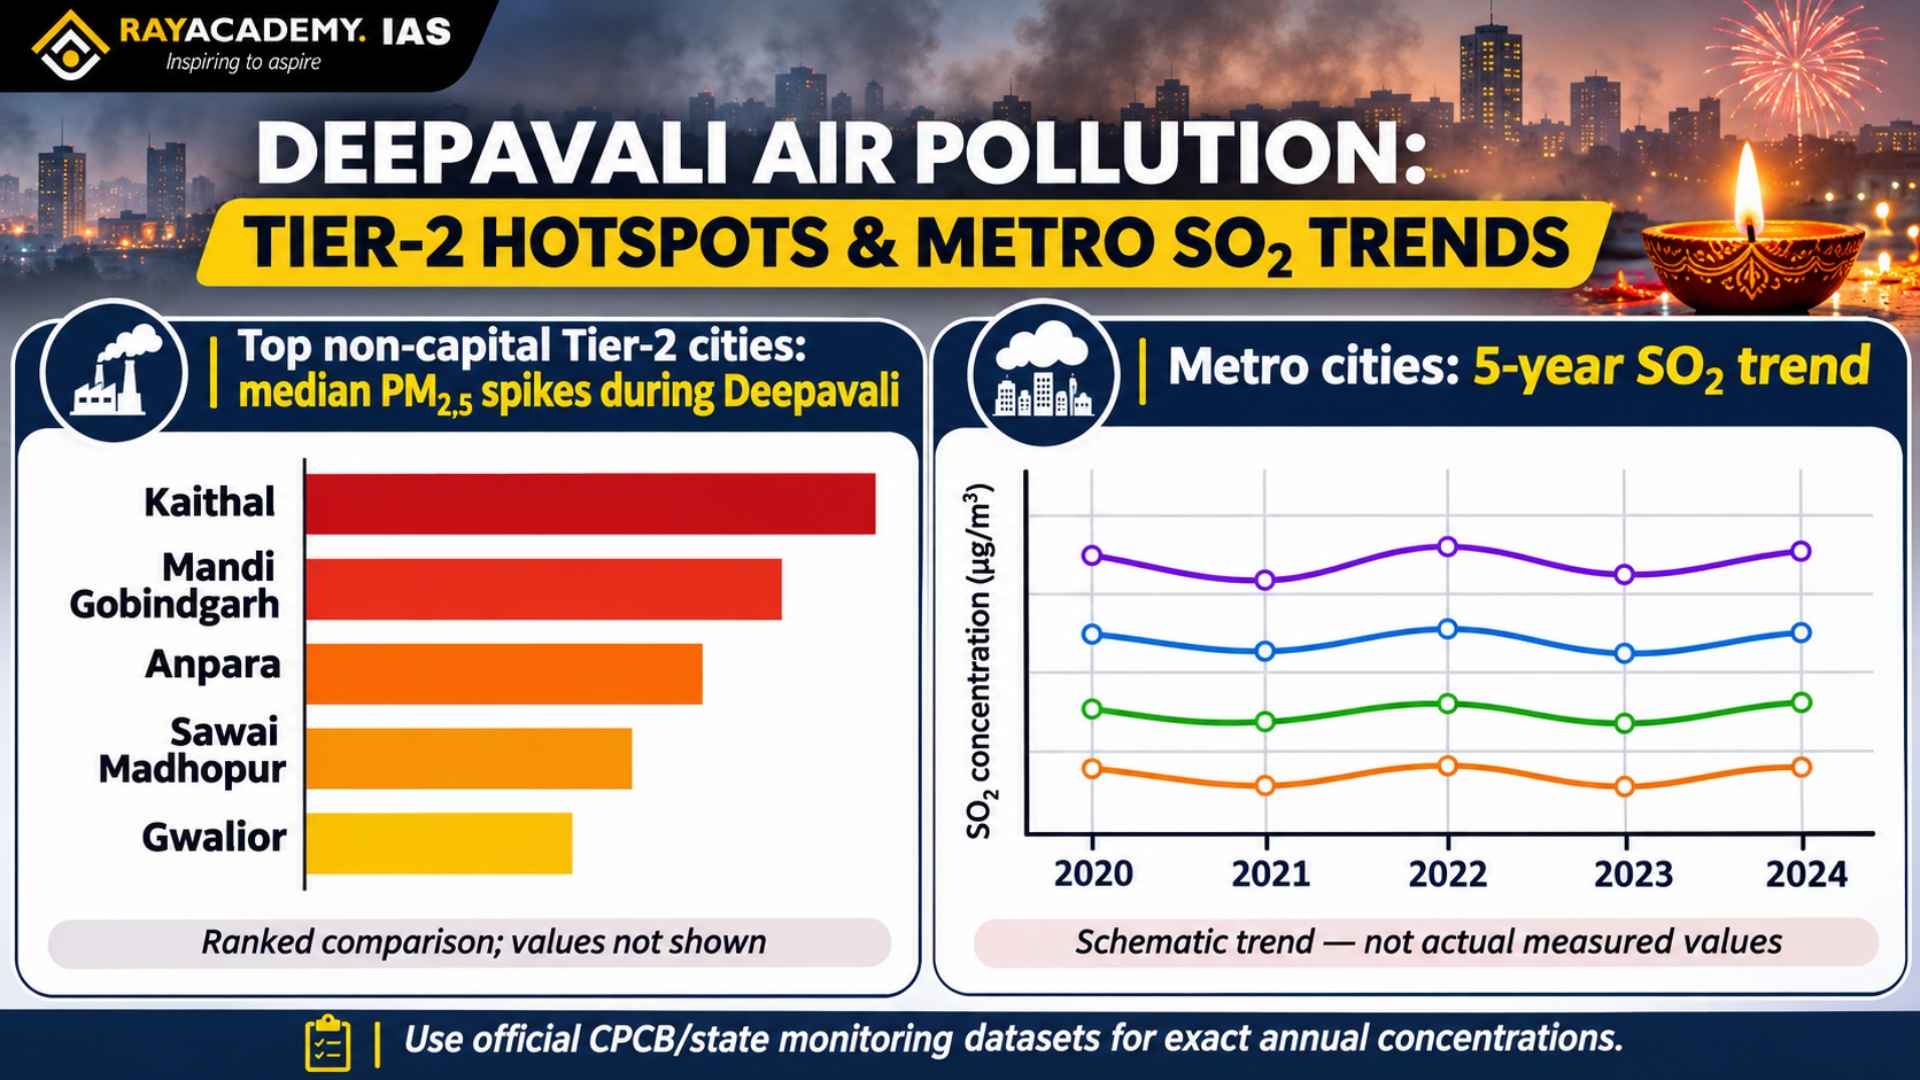
   │ Tier-2 & Industrial Hub Dominance: Kaithal (223 µg/m³),      │
   │ Mandi Gobindgarh (221 µg/m³), Anpara (209 µg/m³) lead peaks  │
   └──────────────────────────────┬───────────────────────────────┘
                                  ▼
   ┌──────────────────────────────────────────────────────────────┐
   │ Green Cracker Implementation Gap: No 5-year drop in SO2 in   │
   │ Delhi, Mumbai, & Kolkata despite regulatory mandates         │
   └──────────────────────────────┬───────────────────────────────┘
                                  ▼
   ┌──────────────────────────────────────────────────────────────┐
   │ Monitoring Blackouts: 202 stations silent on Deepavali;      │
   │ 160 went offline even below the 500 µg/m³ threshold          │
   └──────────────────────────────────────────────────────────────┘
Prelims Focus: High-Yield Objective Facts
Institution / Concept | Key Details & Specifications for UPSC Prelims |
Central Pollution Control Board (CPCB) | Statutory organization constituted in 1974 under the Water (Prevention and Control of Pollution) Act, 1974; also entrusted with powers under the Air (Prevention and Control of Pollution) Act, 1981; functions under MoEFCC. |
National Air Quality Index (NAQI) | Covers 8 pollutants (PM10, PM2.5, NO2, SO2, CO, O3, NH3, Pb); Note that Carbon Dioxide (CO2) and Methane (CH4) are NOT included in NAQI. |
Severe PM2.5 Threshold | Under CPCB classification, 24-hour average PM2.5 concentration exceeding 250 micrograms per cubic metre falls in the Severe category (AQI 401–500). |
Green Crackers (CSIR–NEERI) | Formulated by CSIR–NEERI (headquartered in Nagpur); excludes barium nitrate and heavy metals; three variants: SWAS (Safe Water Releaser), STAR (Safe Thermite Cracker), and SAFAL (Safe Minimal Aluminium). |
Winter Meteorological Inversion | Temperature inversion (warm air trapping cold surface air) combined with low wind speeds and retreating monsoon conditions prevents vertical dispersion of pollutants across the Indo-Gangetic Plain. |
Mains Analytical Breakdown
Significance of Granular Pan-India Air Quality Data
De-Centering the Delhi-Only Narrative: Station-level empirical tracking demonstrates that severe air pollution is a pan-Indian crisis extending across Tier-2 cities and industrial towns—such as Kaithal (Haryana), Mandi Gobindgarh (Punjab), Anpara (U.P.), Sawai Madhopur (Rajasthan), Gwalior (M.P.), and Bileipada (Odisha).
Validating Enforcement Efficacy: Tracking gaseous pollutants like Sulphur Dioxide (SO2) alongside PM2.5 provides an objective audit of whether Supreme Court directives on green crackers and ban orders are translating into compliance on the ground.
Informing Public Health Advisories: Real-time hourly CAAQMS data enables municipal administrations to trigger graded emergency responses—such as the Graded Response Action Plan (GRAP)—to protect vulnerable populations (children, elderly, and respiratory patients).
Multi-Dimensional Challenges
Monitoring Blind Spots and Data Integrity Deficits: Out of 634 total CAAQMS stations, only 571 were live during Deepavali, and 202 stations stopped reporting PM2.5 for at least one hour on Deepavali day. Because 160 of those 202 stations recorded last values of 500 micrograms per cubic metre or below, attributing blackouts solely to the 1,000 micrograms per cubic metre calibration ceiling indicates systemic gaps in sensor maintenance, power backup, and telemetry reliability.
Enforcement Failure of "Green Crackers": Despite judicial mandates pushing green crackers, five-year SO2 trends in Delhi, Mumbai, and Kolkata show no meaningful decline during Deepavali, exposing widespread sale of counterfeit or conventional high-sulphur fireworks and weak municipal enforcement.
Meteorological & Geographical Vulnerability: November coincides with low temperatures, calm winds, and atmospheric inversion across northern and central India, trapping vehicular, industrial, agricultural stubble, and firecracker emissions close to the breathing zone.
Social & Behavioral Compliance Hurdles: Top-down bans without sustained community participation, awareness campaigns, and cultural alternatives often face public resistance and enforcement fatigue among overstretched local police forces.
Health & Economic Externalities: Acute spikes in PM2.5—which penetrates deep into pulmonary alveoli and enters the bloodstream—trigger surges in emergency hospital admissions, school closures, and productivity losses across urban economies.
Way Forward
Upgrade CAAQMS Sensor Calibration and Telemetry Resilience: The CPCB and State Pollution Control Boards (SPCBs) should recalibrate particulate analysers to measure concentrations beyond 1,000 micrograms per cubic metre during extreme episodes, mandate uninterrupted power backups, and publish transparent audit logs explaining every station downtime event.
Enforce Supply-Chain Traceability for Green Crackers: Following Supreme Court directives, PESO (Petroleum and Explosives Safety Organisation) and CSIR–NEERI must enforce mandatory QR-code verification at manufacturing and wholesale hubs, curbing counterfeit barium-based fireworks before they reach retail markets.
Expand Airshed-Level Governance Beyond NCR: Building on the Commission for Air Quality Management (CAQM) model and World Bank airshed frameworks, institutionalize regional airshed authorities across the Indo-Gangetic Plain and central industrial belts to coordinate action across Tier-2 cities.
Strengthen Urban Local Body (ULB) Capacity (2nd ARC Framework): Aligning with the 2nd Administrative Reforms Commission (6th Report on Local Governance), equip municipal bodies with dedicated environmental enforcement squads, mechanical road sweepers, and real-time public health alert systems.
Promote Participatory Community Behavioral Change: Operationalize Mission LiFE (Lifestyle for Environment) through Resident Welfare Associations (RWAs), schools, and civic bodies to encourage community-led, low-emission festival celebrations rather than relying exclusively on coercive policing.
Value Addition for Mains
Empirical CPCB Monitoring Benchmark: During Deepavali 2026, 375 out of 551 reporting CAAQMS stations (~70%) across India recorded peak PM2.5 levels in the severe category (250 micrograms per cubic metre or above), compared to just 96 stations in the pre-Deepavali window—proving that severe air pollution is a nationwide, multi-state governance challenge rather than an isolated metropolitan anomaly.
Constitutional & Judicial Anchor: Under Article 21 (Subhash Kumar v. State of Bihar, 1991) and Article 48A, the Supreme Court has consistently affirmed that the Precautionary Principle and the Right to Clean Air override commercial or celebratory convenience whenever public health is imperiled.
Practice Questions for Active Recall
Prelims Practice MCQ
With reference to air quality monitoring and standards in India, consider the following statements:
The National Air Quality Index (NAQI) monitors eight criteria pollutants, including Particulate Matter (PM2.5 and PM10), Sulphur Dioxide (SO2), and Carbon Dioxide (CO2).
Under the CPCB air quality classification, a 24-hour average PM2.5 concentration above 250 micrograms per cubic metre falls under the "Severe" category.
Green crackers developed by CSIR–NEERI eliminate the use of barium nitrate to reduce particulate and gaseous emissions.
Which of the statements given above are correct?
(a) 1 and 2 only
(b) 2 and 3 only
(c) 1 and 3 only
(d) 1, 2, and 3
Correct Answer: (b) 2 and 3 only
Explanation:
Statement 1 is incorrect: The National Air Quality Index (NAQI) covers 8 pollutants (PM10, PM2.5, NO2, SO2, CO, O3, NH3, and Lead). Carbon Dioxide (CO2) is a greenhouse gas and is not included in NAQI.
Statement 2 is correct: Per CPCB standards, 24-hour PM2.5 levels exceeding 250 micrograms per cubic metre are categorized as Severe (corresponding to AQI 401–500).
Statement 3 is correct: Green crackers formulated by CSIR–NEERI (SWAS, STAR, SAFAL) replace harmful oxidizers like barium nitrate and heavy metals to lower particulate and SO2/NOx emissions.
Mains Practice Question (GS Paper III — 150 Words | 10 Marks)
"Recent CPCB monitoring data demonstrates that severe air pollution during festive seasons is no longer confined to metropolitan cities, while significant gaps persist in both sensor reliability and regulatory enforcement." Discuss the key findings regarding pan-India PM2.5 spikes and suggest institutional reforms to strengthen air quality governance.
Answer Structure Hints:
Introduction: Contextualize the CPCB CAAQMS data showing ~70% of reporting stations across India—spanning Delhi and at least seven other States, alongside Tier-2 industrial towns—recording severe PM2.5 (250 micrograms per cubic metre or above) during Deepavali.
Body Part 1 (Key Findings & Governance Gaps): Highlight pan-India spread across non-capital hubs (Kaithal, Mandi Gobindgarh, Anpara), station data blackouts (202 stations silent on Deepavali despite readings below the 1,000 micrograms per cubic metre calibration cap), and stagnant five-year SO2 levels reflecting weak enforcement of green cracker norms.
Body Part 2 (Institutional Reforms): Recommend upgrading CAAQMS sensor calibration ceilings and telemetry uptime, enforcing QR-based supply-chain audits for green crackers via PESO/NEERI, scaling regional airshed governance, and promoting participatory compliance under Mission LiFE.
Conclusion: Conclude with Article 21 (Right to Clean Air) and the Precautionary Principle, emphasizing that transparent data and regional coordination are essential to protect public health.
Take this article with you
Save a reading copy for offline study.


