

On this page
Series-High Core Sector
Expansion: Provisional data released by the Ministry of Commerce and Industry on November 20, 2026, revealed that India’s Index of Core Industries (ICI) accelerated to a series-high 10.9% year-on-year (YoY) growth in October 2026, surpassing the revised September 2026 final growth rate of 8.2%.
OPSC Syllabus Mapping:
General Studies Paper III (Indian Economy): Indian Economy and issues relating to planning, mobilization of resources, growth, development and employment; Inclusive growth and issues arising from it; Effects of liberalization on the economy, changes in industrial policy and their effects on industrial growth; Infrastructure: Energy, Ports, Roads, Airports, Railways etc.
Key Sectoral Drivers: The surge was propelled by sharp expansions in iron ore (26.4%), coal (23.1%), electricity generation (21.6%), cement (15.4%), and steel (7.3%), alongside a favourable low base effect from October 2025 (when overall core output grew by just 0.8%).
Cumulative Seven-Month Momentum: For the April–October 2026 period, cumulative ICI growth stood at 6.0%, markedly higher than the 2.3% recorded during the corresponding period of FY 2025–26.
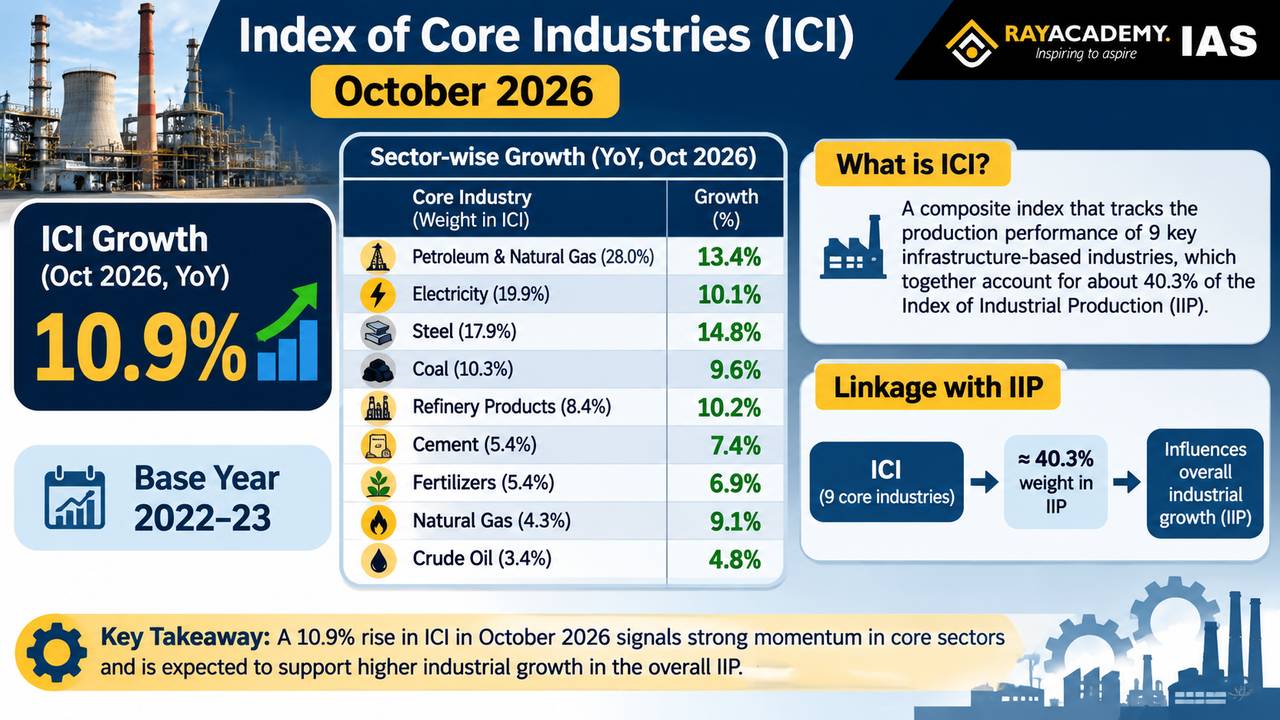
Static-Current Linkage: Macroeconomic Architecture of ICI and IIP
What is the Index of Core Industries (ICI)?
The Index of Core Industries (ICI) is a high-frequency monthly volume index compiled and released by the Office of the Economic Adviser (OEA) under the Department for Promotion of Industry and Internal Trade (DPIIT), Ministry of Commerce and Industry. Often described as the "industrial pulse of the economy", it measures the combined and individual production performance of foundational infrastructure industries that supply essential energy and intermediate inputs across the economy.
The Revised Base Year 2022–23 Series
In July 2026, the OEA replaced the legacy 2011–12 series with a modernized Base Year 2022–23 series (harmonized with revised GDP, WPI, and IIP base years):
Expansion from Eight to Nine Core Sectors: While popular media still colloquially refers to the "eight core sectors", the revised 2022–23 series formally added Iron Ore as the ninth core industry alongside Coal, Crude Oil, Natural Gas, Refinery Products, Fertilizers, Steel, Cement, and Electricity.
Revised Weight in IIP: The combined weight of core industries in the broader Index of Industrial Production (IIP)—compiled monthly by the National Statistical Office (NSO) under MoSPI—was recalibrated to 32.88% (down from 40.27% under the 2011–12 series) to reflect structural diversification in Indian manufacturing.
Methodological Refinements: The revised series uses Gross Production Data for steel, retains only Raw Coal (excluding coal middling and washed coal to prevent double counting), and establishes a Linking Factor of 1.47 for historical continuity.
Prelims Focus: High-Yield Objective Facts
Nodal Compiling Agency: Office of the Economic Adviser (OEA), DPIIT, Ministry of Commerce and Industry (provisional data is normally released on the 20th of the following month, preceding the IIP release).
Sectoral Weights in ICI (Base Year 2022–23, Total = 100%):
Electricity: 30.93% (Highest weight)
Refinery Products: 22.57%
Steel: 17.58%
Crude Oil: 7.43%
Coal: 5.59%
Iron Ore: 4.90% (Newly added 9th sector)
Cement: 4.41%
Natural Gas: 3.84%
Fertilizers: 2.73% (Lowest weight)
October 2026 Sectoral Snapshot (YoY):
Positive Growth: Iron Ore (+26.4%), Coal (+23.1%), Electricity (+21.6%), Cement (+15.4%), Steel (+7.3%), Refinery Products (+3.4%).
Negative Growth (Contraction): Natural Gas (-7.6%), Crude Oil (-4.1%), Fertilizers (contracted in October; -8.3% cumulative in April–October 2026).
Source Data Agencies: Central Electricity Authority (Electricity), Office of the Coal Controller (Coal), Joint Plant Committee (Steel), Ministry of Petroleum & Natural Gas (Crude Oil, Natural Gas, Refinery Products), and Department of Fertilizers (Fertilizers).
Mains Analytical Breakdown
Economic Significance of the Core Sector Surge
Sustained Public Capital Expenditure (Capex) Multiplier: Robust double-digit growth in cement (15.4%), iron ore (26.4%), and steel (7.3%) signals healthy construction, housing, and infrastructure execution across roads, railways, and urban corridors.
Thermal Power and Coal Value-Chain Synergy: Coal India’s 19% production jump (reaching 67.2 million tonnes in October) directly supported the 21.6% surge in electricity generation, averting peak-load power deficits during festive industrial and commercial demand.
Leading Indicator for Q3 GDP and IIP: Because core industries constitute nearly one-third (32.88%) of the IIP and supply downstream manufacturing, a 10.9% ICI print points toward resilient industrial Gross Value Added (GVA) in Q3 FY 2026–27.
Structural Challenges and Analytical Nuances
1. Statistical Distortion from the Low Base Effect
Festive Calendar & Base Effects: As economists at ICRA noted, October 2026’s headline figure was heavily amplified by a statistical low base—in October 2025, overall core growth was just 0.8%, with coal contracting by 8.4% and electricity contracting by nearly 7% due to festive calendar shifts. Stripping out base effects suggests moderate sequential momentum rather than an overheating boom.
2. Persistent Upstream Hydrocarbon Stagnation
Structural Contraction in Crude Oil and Natural Gas: Despite high-level policy reforms under the Hydrocarbon Exploration and Licensing Policy (HELP), domestic crude oil (-4.1%) and natural gas (-7.6%) output continued to contract due to maturing ageing fields (such as Mumbai High), locking India into >85% crude import dependence.
3. Fertilizer Sector Contraction and Agri-Input Risks
Supply-Side Pressures Ahead of Rabi: Cumulative contraction in fertilizer production (-8.3% during April–October 2026) amid elevated global feedstock prices raises fiscal subsidy pressures and underscores the need for domestic nano-urea and green ammonia scaling ahead of the Rabi sowing season.
4. Carbon Intensity of Core Industrial Growth
Energy Transition Dilemma: India’s core growth remains heavily anchored in fossil-fuel-intensive sectors (coal, thermal electricity, cement, and blast-furnace steel), posing decarbonization challenges under India’s Panchamrit climate commitments and the European Union’s Carbon Border Adjustment Mechanism (CBAM).
Way Forward
Revitalizing Upstream Hydrocarbon Exploration: Accelerate bidding rounds under OALP (Open Acreage Licensing Policy), incentivize Enhanced Oil Recovery (EOR) technologies in mature fields, and expand National Green Hydrogen Mission pilots in refineries and fertilizer plants to curb fossil import bills.
Sustaining Public-Private Capex Crowding-In: Anchor infrastructure momentum through the National Infrastructure Pipeline (NIP) and PM Gati Shakti multimodal logistics master plan while improving Ease of Doing Business to crowd in private manufacturing capex.
Greening Hard-to-Abate Core Sectors: Operationalize the Carbon Credit Trading Scheme (CCTS) under the Energy Conservation (Amendment) Act, 2022, incentivizing green steel, blended cement, and renewable energy integration in industrial clusters.
Strengthening High-Frequency Data Granularity: In line with National Statistical Commission recommendations, integrate GST e-way bill and FASTag logistics telemetry with OEA’s monthly industrial indicators to separate seasonal/base-effect noise from true structural capacity utilization.
Value Addition for Mains Answers
Key Data Points (PIB & OEA, November 2026):
Headline ICI Growth (Oct 2026): 10.9% YoY (series high under Base Year 2022–23); Cumulative Growth (Apr–Oct 2026): 6.0% (vs. 2.3% in Apr–Oct 2025).
Weightage Shift: Under Base Year 2022–23, core industries account for 32.88% of IIP, with Electricity (30.93%) holding the single largest weight and Iron Ore (4.90%) newly included as the 9th sector.
Economic Survey Linkage: The Economic Survey underscores that "sustained public infrastructure capex acts as the primary fulcrum for crowding in private investment, boosting core industrial capacity utilization, and driving medium-term potential GDP growth."
Practice Questions for Active Recall
Prelims Practice MCQ
With reference to the revised Index of Core Industries (ICI) with Base Year 2022–23 in India, consider the following statements:
The Index of Core Industries is compiled and released monthly by the National Statistical Office (NSO) under the Ministry of Statistics and Programme Implementation.
Under the revised Base Year 2022–23 series, Iron Ore has been included as the ninth core industry, and Electricity carries the highest individual weight within the index.
Together, the core industries account for more than 40% of the total weight of items included in the Index of Industrial Production (IIP).
Which of the statements given above is/are correct? A. 1 and 2 only
B. 2 only
C. 2 and 3 only
D. 1, 2 and 3
Correct Answer: B
Explanation:
Statement 1 is incorrect: The Index of Core Industries (ICI) is compiled and released by the Office of the Economic Adviser (OEA), Department for Promotion of Industry and Internal Trade (DPIIT), Ministry of Commerce and Industry (whereas the broader IIP is compiled by NSO under MoSPI).
Statement 2 is correct: Under the revised Base Year 2022–23 series, Iron Ore was added as the ninth core sector, and Electricity (30.93%) holds the highest weight within the ICI, surpassing Refinery Products (22.57%).
Statement 3 is incorrect: Under the revised 2022–23 base series, the combined weight of core industries in the IIP was updated to 32.88% (down from 40.27% in the earlier 2011–12 series).
Mains Practice Question (GS Paper III – 150 Words / 10 Marks)
"While the surge in India’s Index of Core Industries reflects resilient infrastructure momentum, underlying sectoral divergences and base effects call for calibrated policy interventions." Examine the trends in India’s core industrial output and suggest measures to sustain broad-based industrial growth.
Answer Structure Hint:
Introduction: Cite the 10.9% YoY growth in the Index of Core Industries (ICI) in October 2026 (and 6.0% cumulative growth for Apr–Oct 2026) under the Base Year 2022–23 series.
Body: Analyze key drivers—strong expansion in iron ore (26.4%), coal (23.1%), electricity (21.6%), cement (15.4%), and steel (7.3%) fueled by infrastructure capex. Contrast this with vulnerabilities: statistical distortion from October 2025's low base (0.8%), persistent contraction in domestic crude oil and natural gas, fertilizer output decline, and high carbon intensity. Suggest measures (OALP upstream reforms, green steel/cement decarbonization under CCTS, PM Gati Shakti logistics efficiency, and private capex crowding-in).
Conclusion: Conclude by linking competitive, low-carbon core infrastructure to India’s manufacturing competitiveness and Viksit Bharat 2047 goals.
Take this article with you
Save a reading copy for offline study.


